


A Data-Driven Approach to Agent Development
dotloop
November 27, 2017 | comments
Gain insight into agent performance with the Report Builder
As a real estate broker or team leader, the coaching and developing of your agents should be among your top business priorities. Any effort that leads to the performance enhancement of your employees has a positive impact on morale as it demonstrates your commitment to their success.
But why is employee morale important? Put simply, happy agents are more likely to develop a stronger sense of loyalty to your brokerage, which translates to talent retention. As we’ve touched in a previous post, retaining agents is far easier and more cost-effective than hiring new ones. In other words, employee development can have a positive monetary effect on your brokerage.
To properly coach agents, you need to have a clear understanding of where each one currently stands in terms of performance. This is where dotloop’s Report Builder comes into play.
We’ve created a free Excel template that automatically generates a report using transactional data exported from your dotloop account. This report will help you determine which agents are “crushing it” and can take on a mentorship role, and which have growth opportunities.
This proactive and data-driven approach to agent development empowers you to establish an internal learning network where seasoned agents can provide their success tactics to younger colleagues in a casual setting. All to create a positive environment that will ultimately grow your business.
To get started, download the Excel template and follow these four steps:
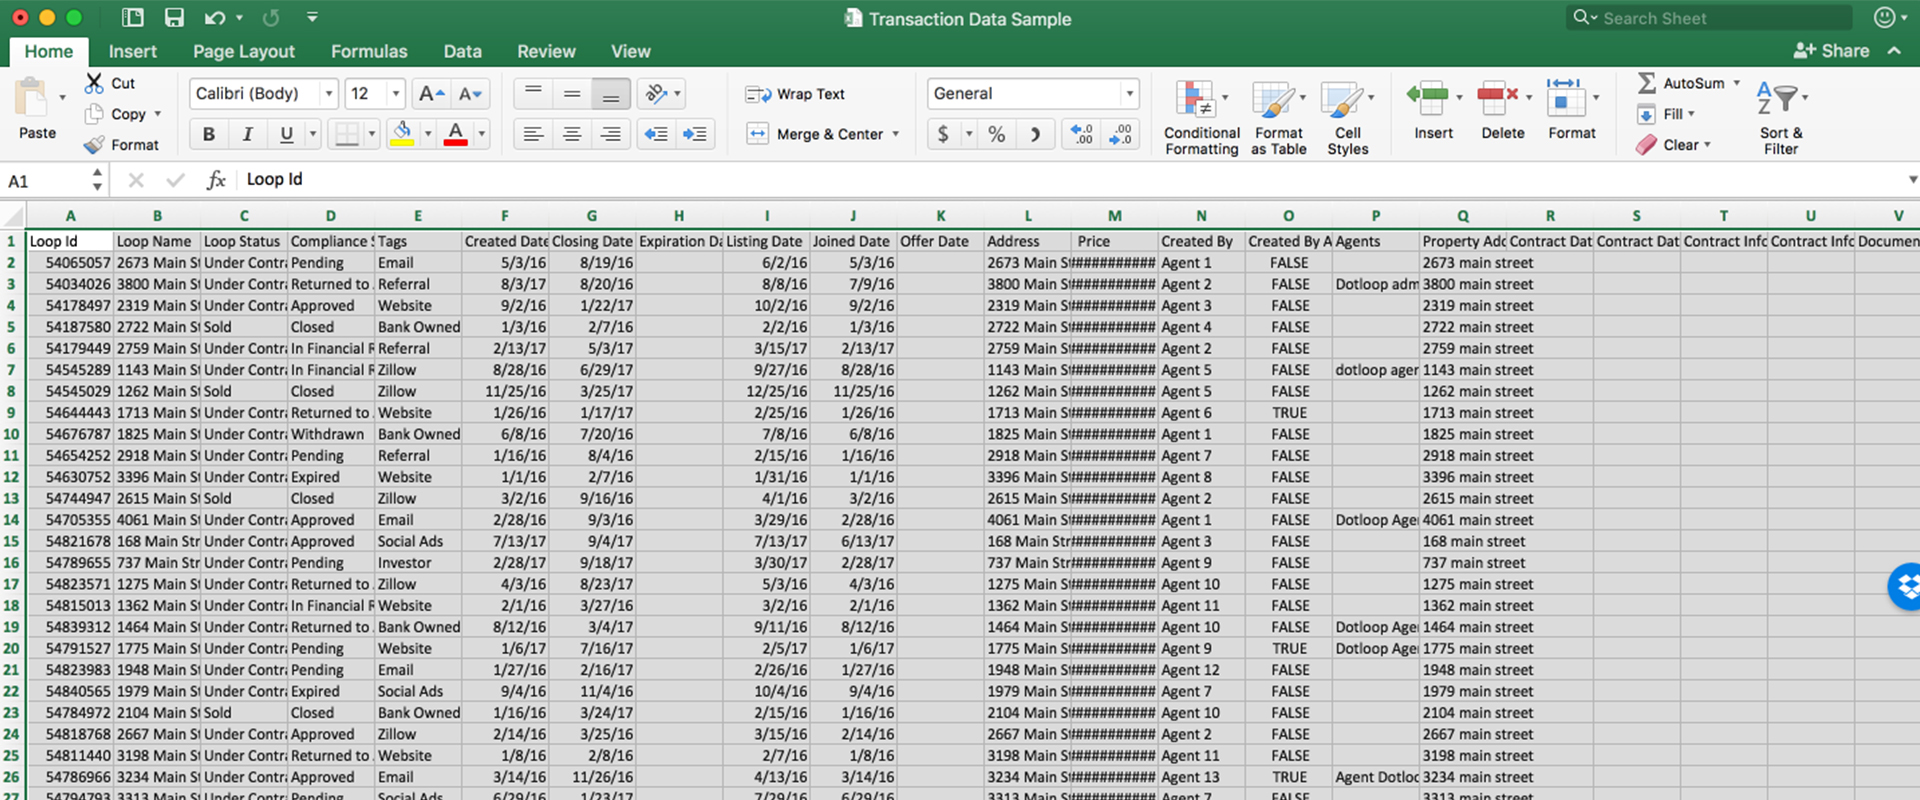
STEP 1: Export and select all your transaction data
Once you’ve downloaded your data using the Report Builder, open the CSV file, select all the data using CTRL + A, and copy it to your clipboard using CTRL + C.
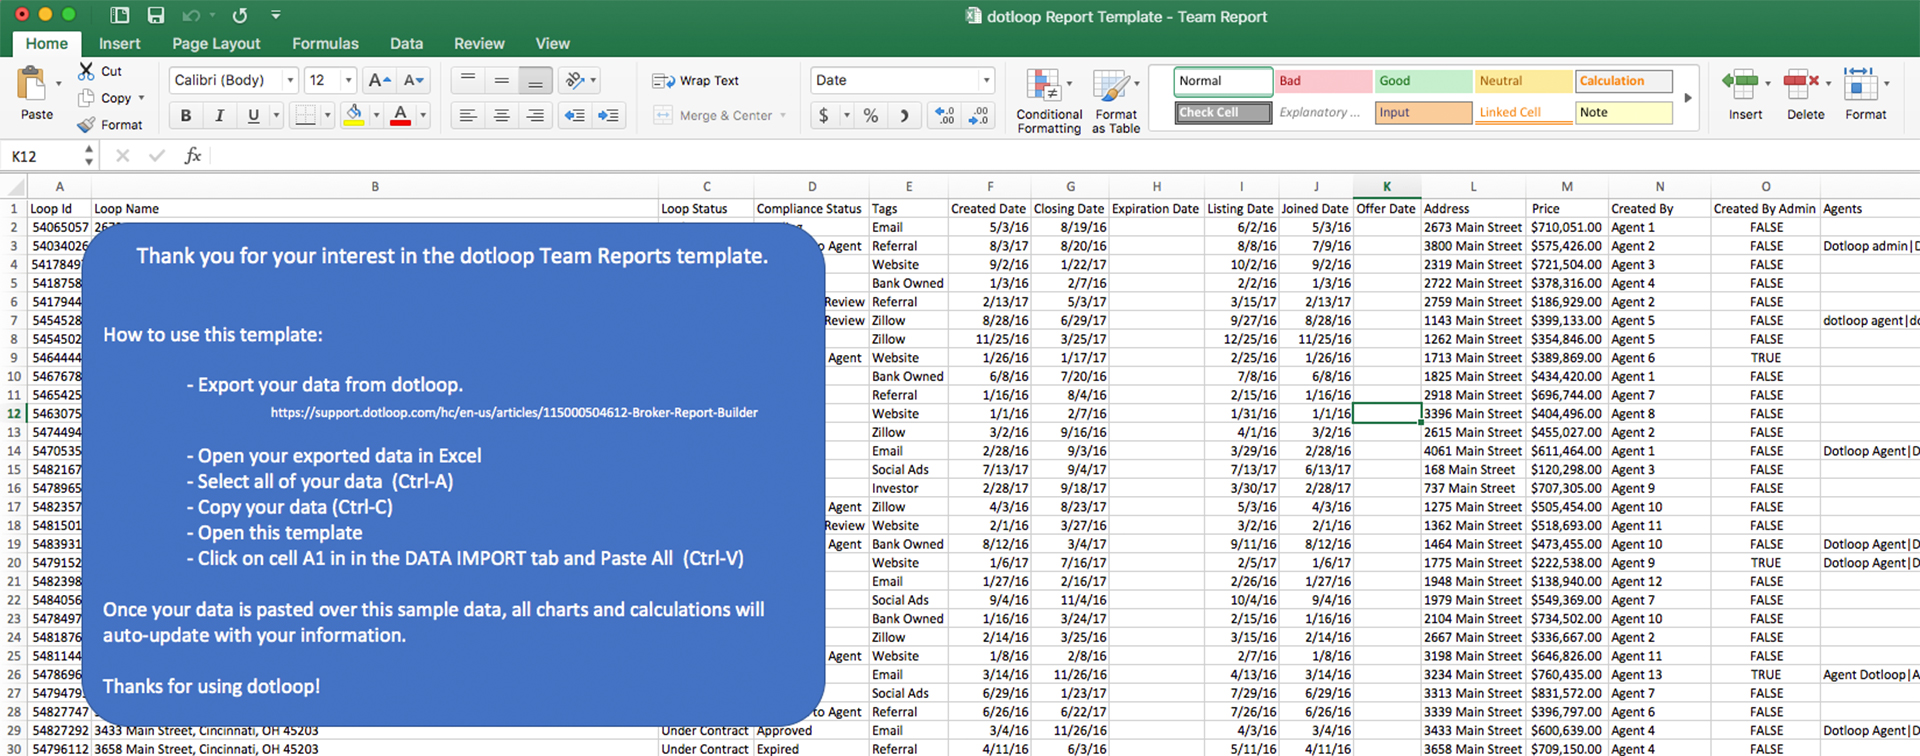
STEP 2: Open the Team Report Template
When you open the template, you’ll see 2 things on the first tab:
1. A “How to use this template” section. Once you’re you’re familiar with the steps, please feel free to delete by clicking on the section and hitting DEL.
2. Sample transaction data. This placeholder data exists to help you visualize what your report will look like when finished – it can also be deleted when ready.
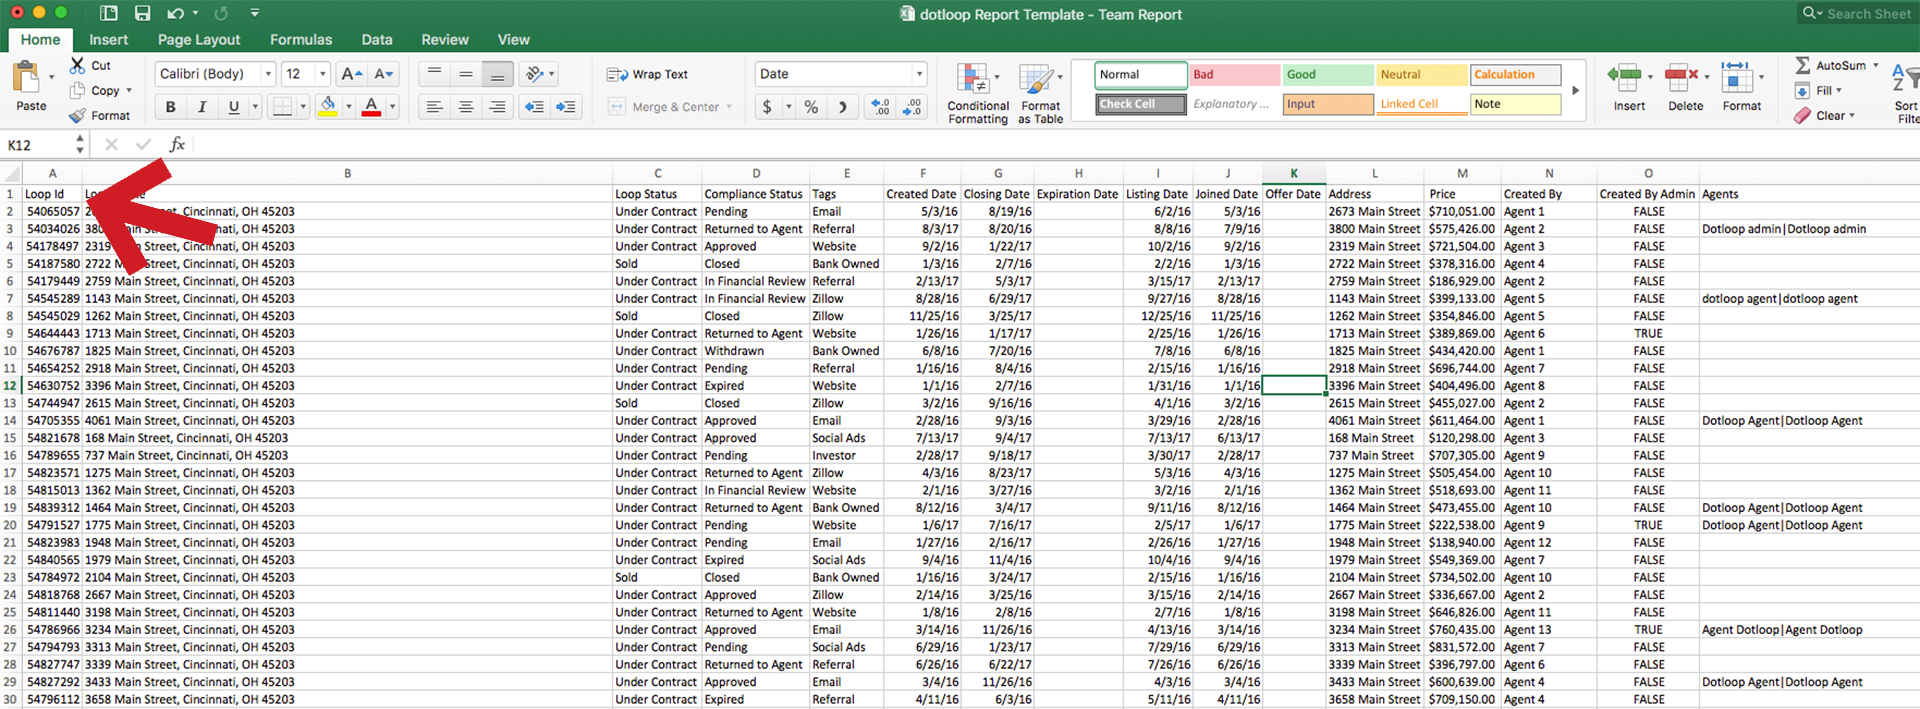
STEP 3: Paste all your data
Click on cell A1 in the DATA IMPORT tab and paste all your data using CTRL + V.
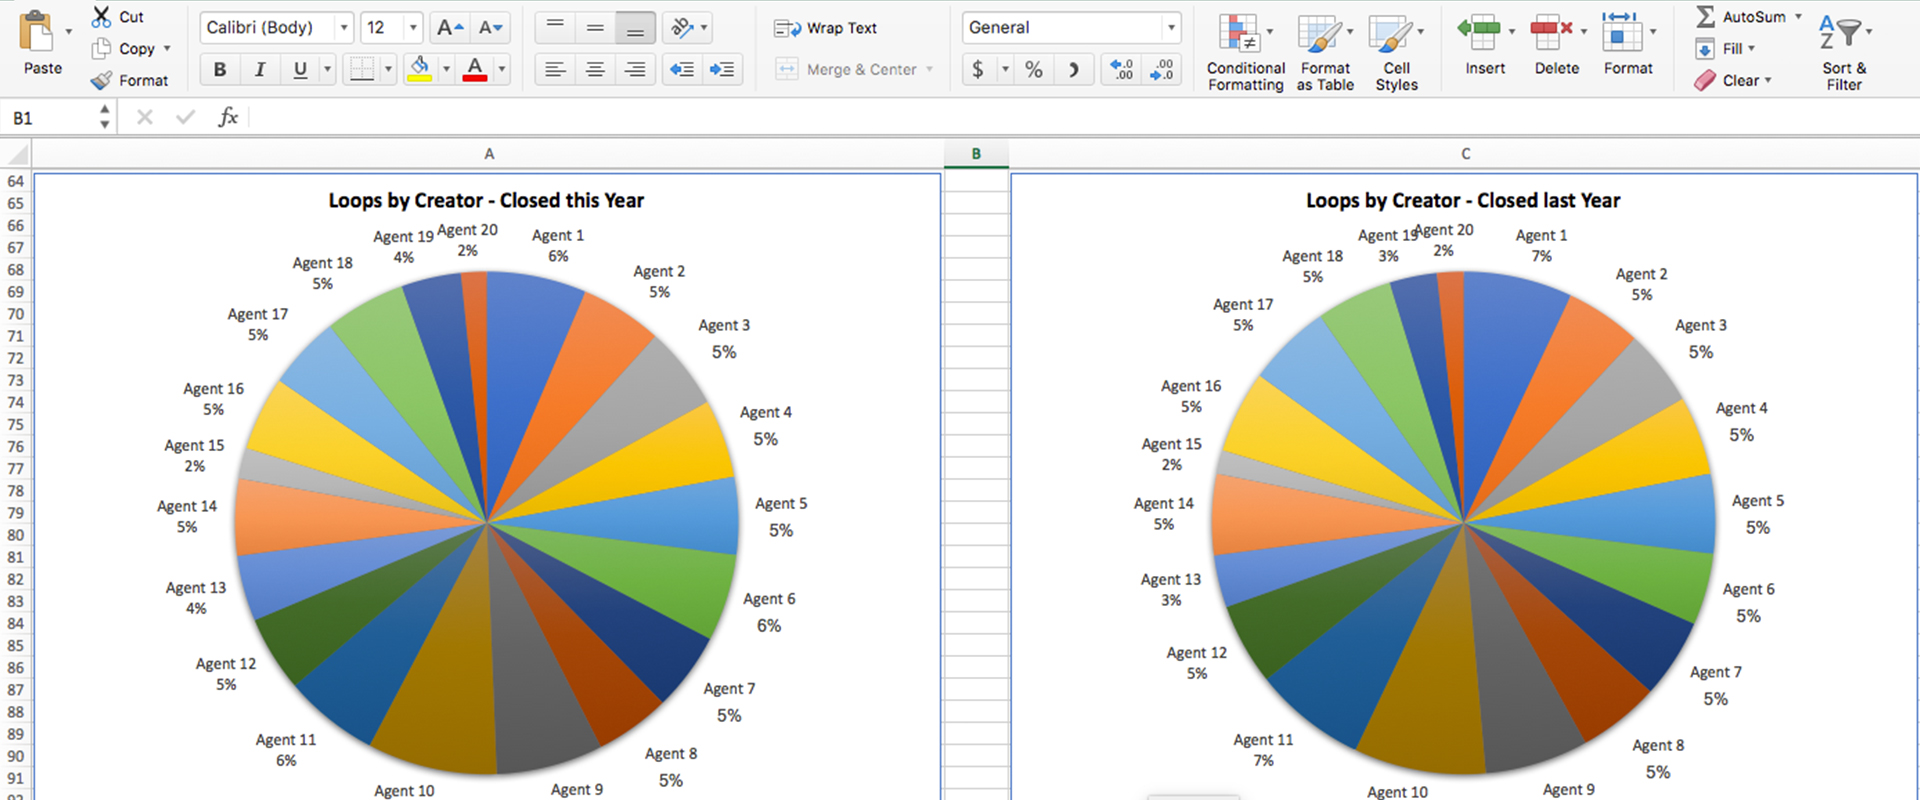
STEP 4: Analyze and digest your data
The template will break down your data and automatically populate a report that you can easily analyze in tabs “Charts – Teams” and “Calculations – DO NOT EDIT”.
The “Charts – Teams” tab will show you how many transactions each agent closed and how their number compares (percentage-wise) to the rest of the team by month and year. The “Calculations – DO NOT EDIT” tab will drill down into the monthly value of all transaction by stage and other more granular metrics.
To learn other use case scenarios for the Report Builder, check out our previous post:
• Making Data-Driven Decisions to Grow Your Real Estate Business
• Unleash the Power of Your Report Builder Data: Sorting and Filtering
• Visualize Your Sales Funnel with the Report Builder
• Using the Report Builder to create financial reports.