Using the Report Builder to Create Financial Reports
Imagine that it’s been a banner year for your brokerage: you’ve scaled up your team, everyone in town knows your name, and you’re selling houses like hotcakes. But how many houses have you sold? When did they sell and how much did they sell for? How many transactions do you have under contract? And how is your banner year tracking against your sales last year?
To find out, simply download a CSV of your data, then download this template and follow the instructions on the first tab.
STEP 1: Export and select all your transaction data
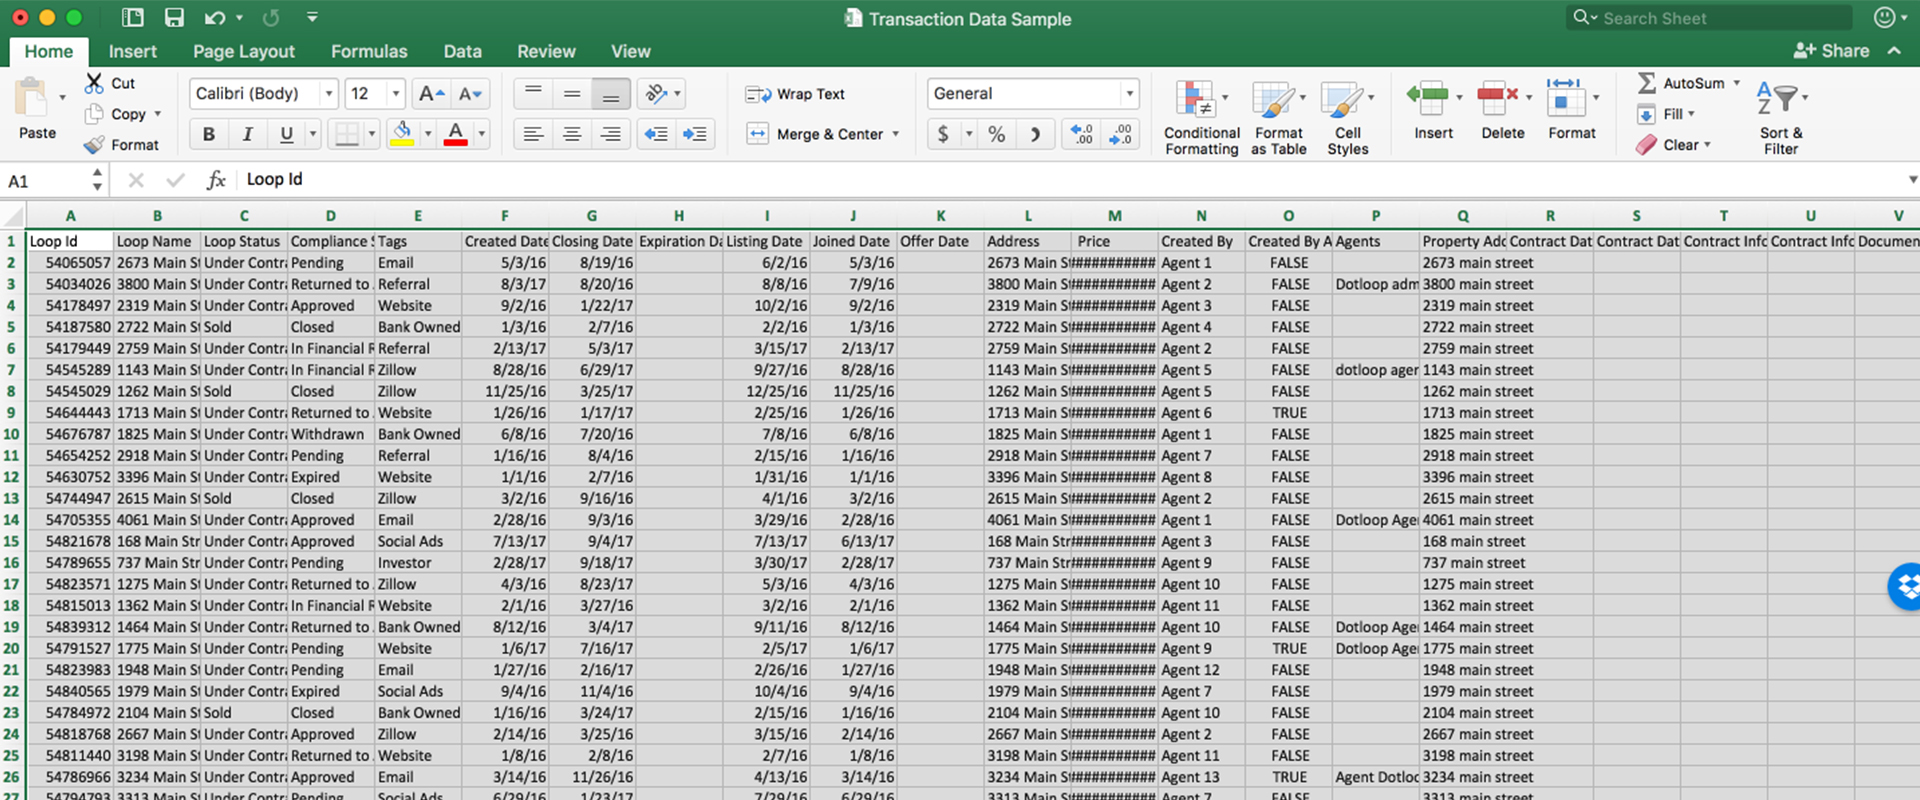
Once you’ve downloaded your data using the Report Builder, open the CSV file, sellect all the data using CTRL + A, and copy it to your clipboard using CTRL + C.

STEP 2: Open the Financial Report template
When you open the template, you’ll see 2 things on the first tab:
1. A “How to use this template” section. Once you’re you’re familiar with the steps, please feel free to delete by clicking on the section and hitting DEL.
2. Sample transaction data. This placeholder data exists to help you visualize what your report will look like when finished.

STEP 3: Paste all your data
Click on cell A1 in the DATA IMPORT tab and paste all your data using CTRL + V.

STEP 4: Analyze and digest your data
The template will break down your data and automatically populate a report that you can easily analyze in tabs Charts – Financial and Calculations – DO NOT EDIT.

Stay tuned for more tips and templates that will help you gain insight into the performance of your real estate brokerage or team!
• Unleash the Power of Your Report Builder Data: Sorting and Filtering
• [WEBINAR RECORDING] Making Data-Driven Decisions to Grow Your Real Estate Business
• Introducing Dotloop’s Newest Feature: The Report Builder


