Visualize Your Sales Funnel with the Report Builder
Tag your Real Estate Transactions for easy
In dotloop, there’s an infinite number of ways to tag your real estate transactions. Think of Loop Tags as electronic Post-it notes to help you categorize transactions based on any business criteria.
While tagging is useful, wouldn’t it be amazing to see what sources bring in the most closed transactions?
Case in point: one of our favorite ways of tagging loops is by Lead Source – that is, to understand which channel is generating more business (e.g., email, referral, Zillow).
With the combined powers of the Report Builder and Excel, it’s easy to see patterns in your data. Simply download a CSV of your data, then download this template and follow the instructions below.
STEP 1: Export and select all your transaction data
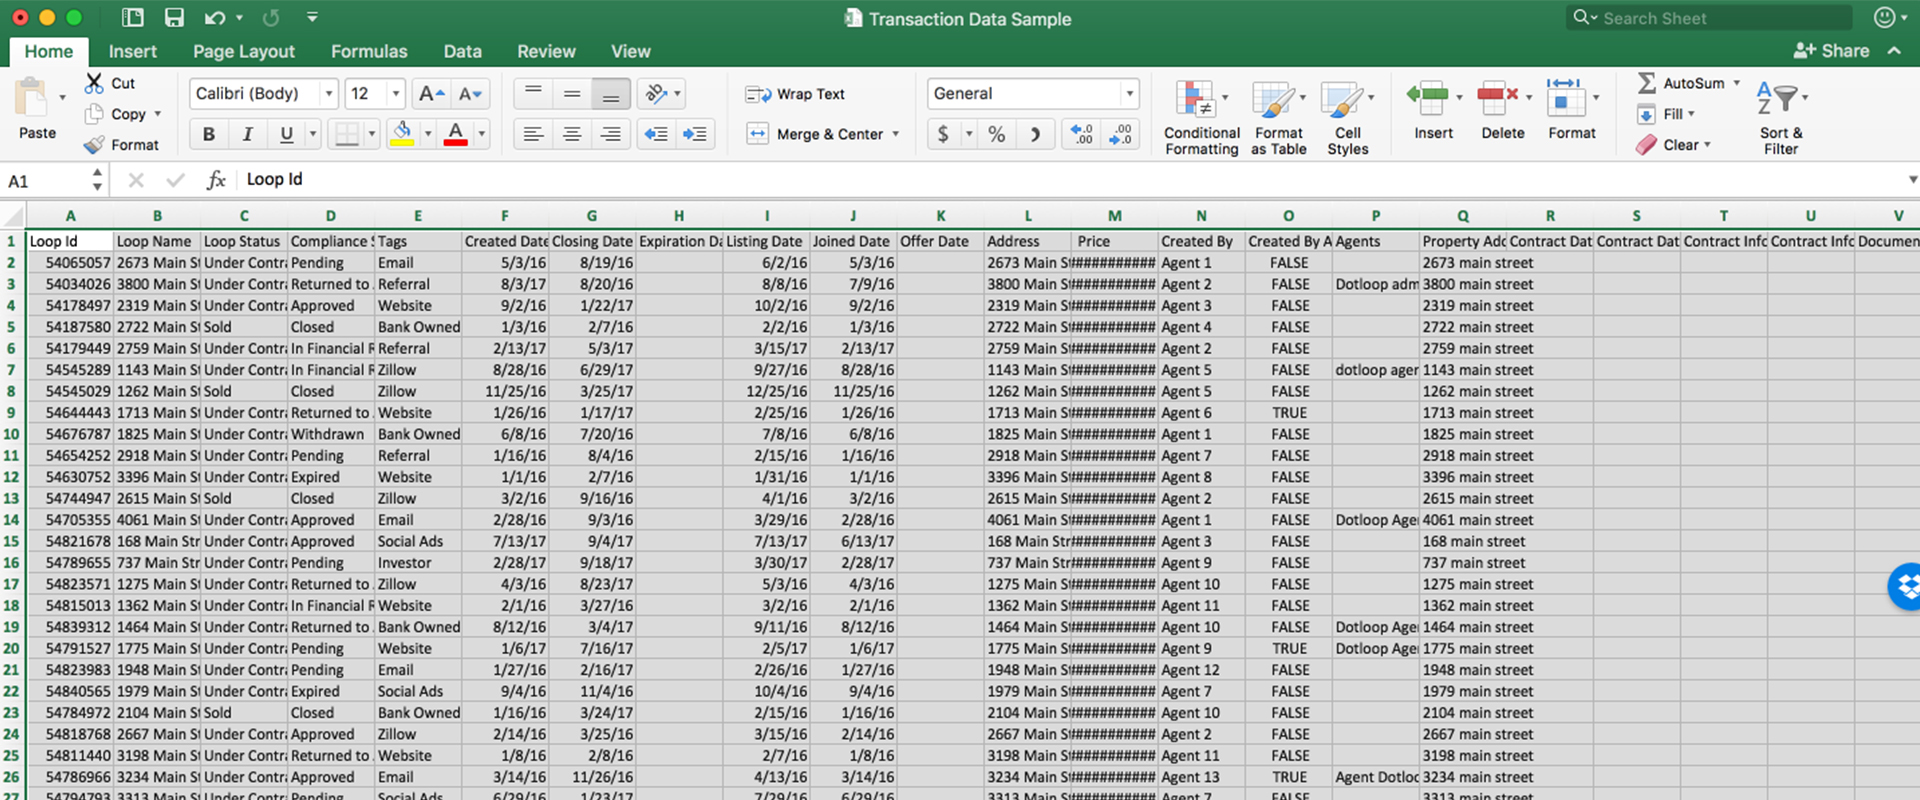
Once you’ve downloaded your data using the Report Builder, open the CSV file, select all the data using CTRL + A, and copy it to your clipboard using CTRL + C.

STEP 2: Open the Financial Report template
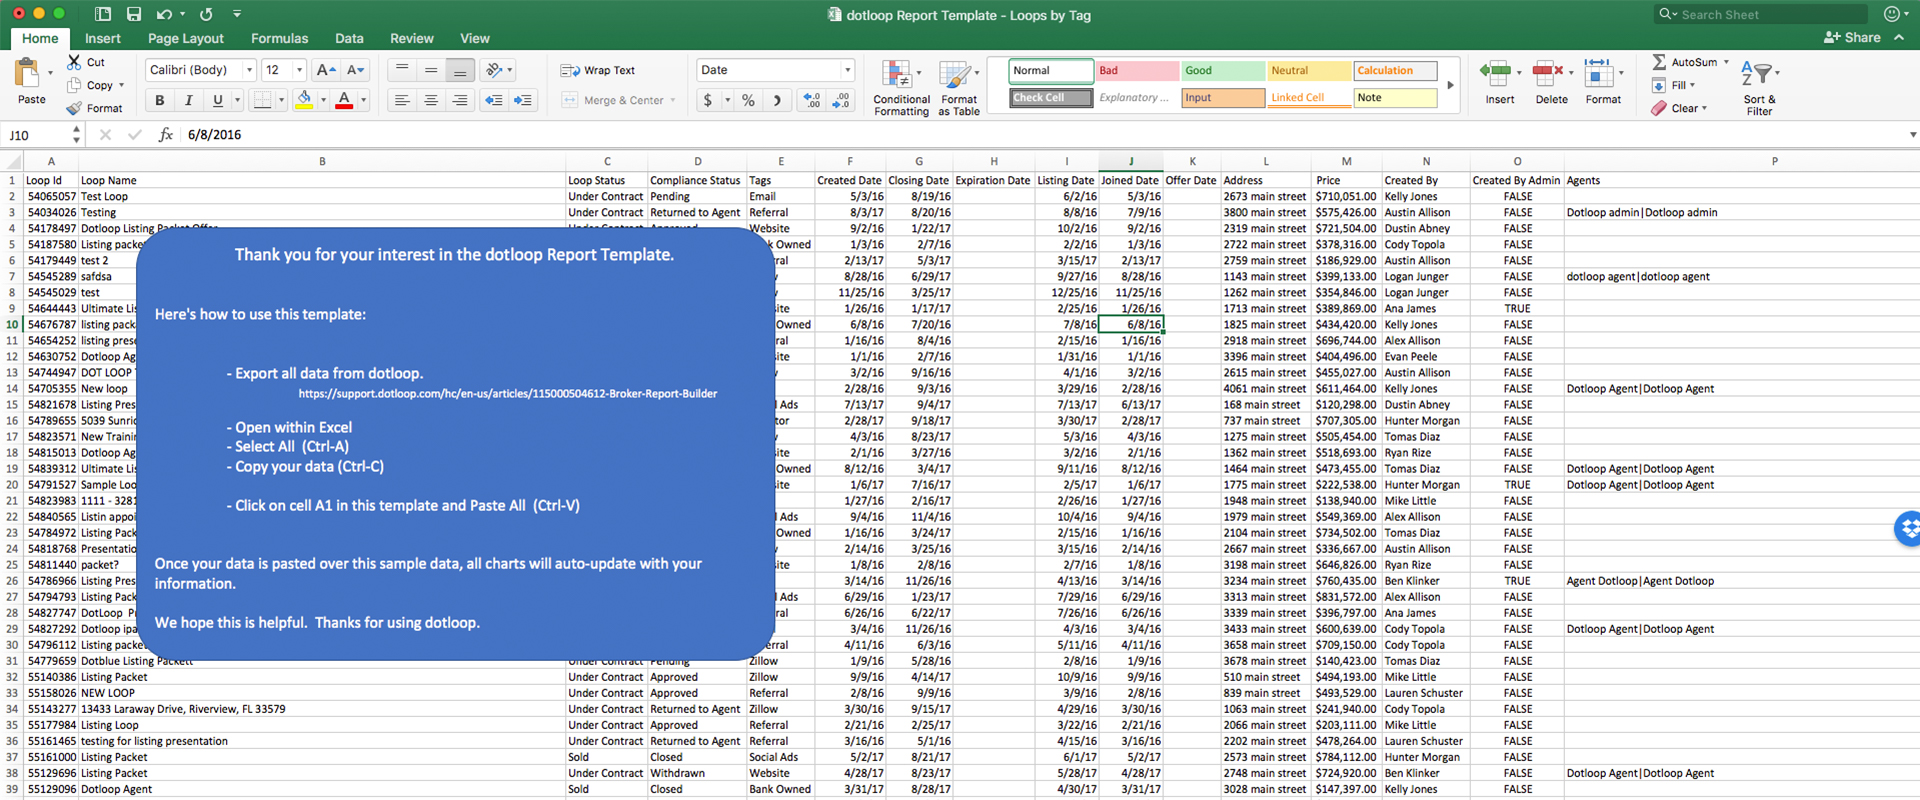
When you open the template, you’ll see 2 things on the first tab:
1. A “How to use this template” section. Once you’re you’re familiar with the steps, please feel free to delete by clicking on the section and hitting DEL.
2. Sample transaction data. This placeholder data exists to help you visualize what your report will look like when finished.

STEP 3: Paste all your data
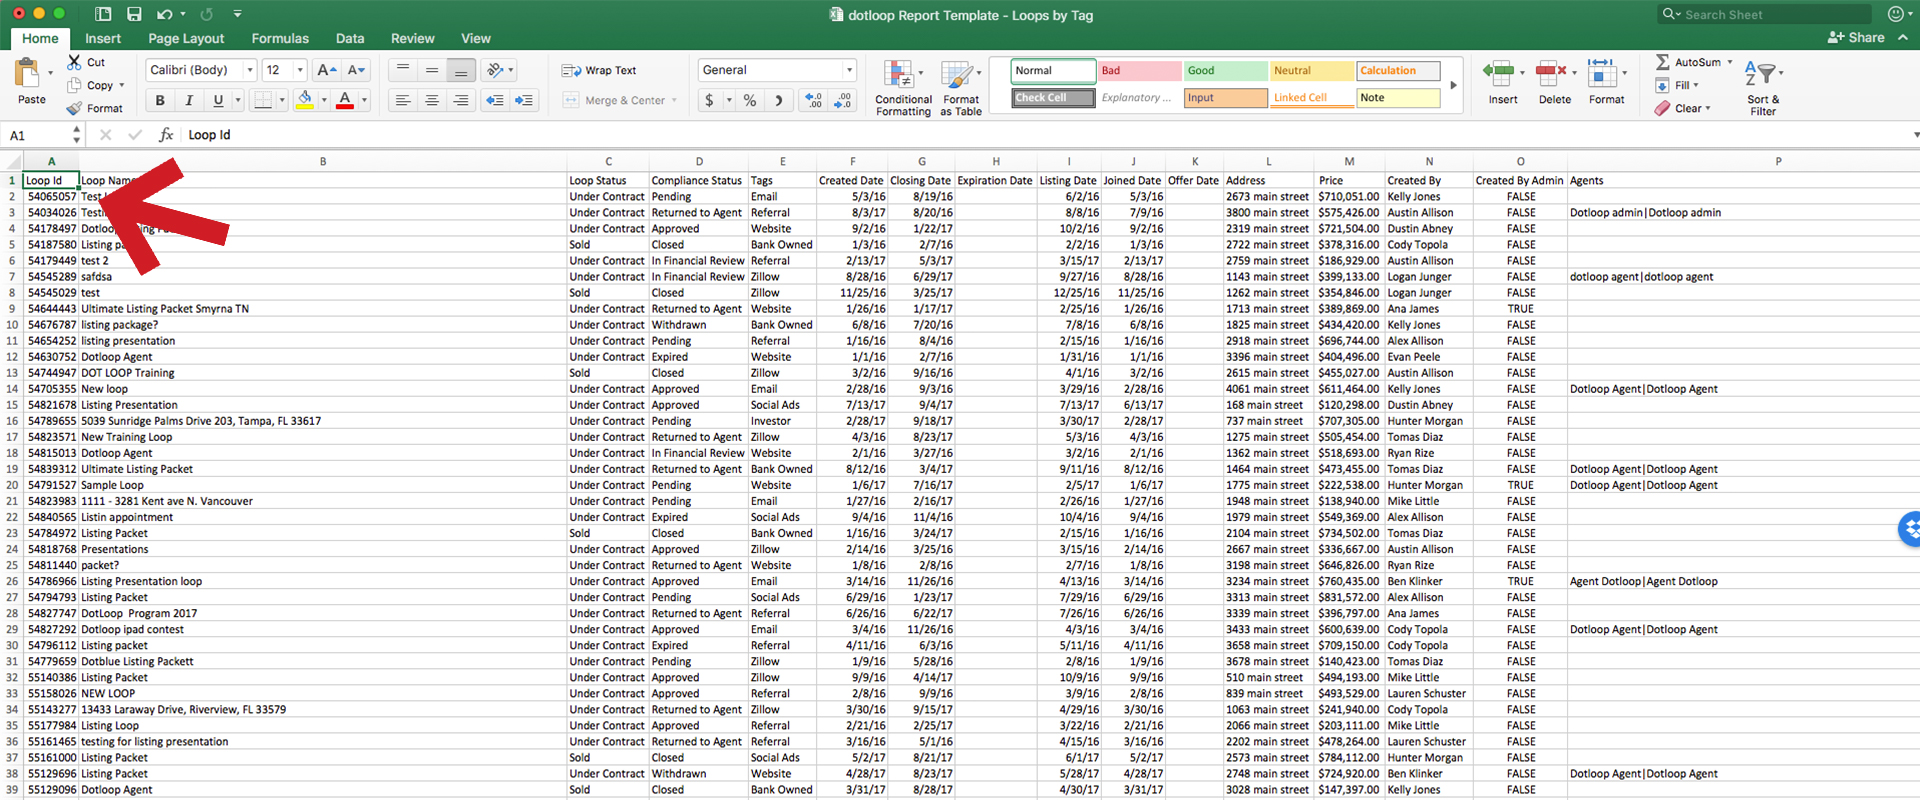
Click on cell A1 in the DATA IMPORT tab and paste all your data using CTRL + V.

STEP 4: Analyze and digest your data
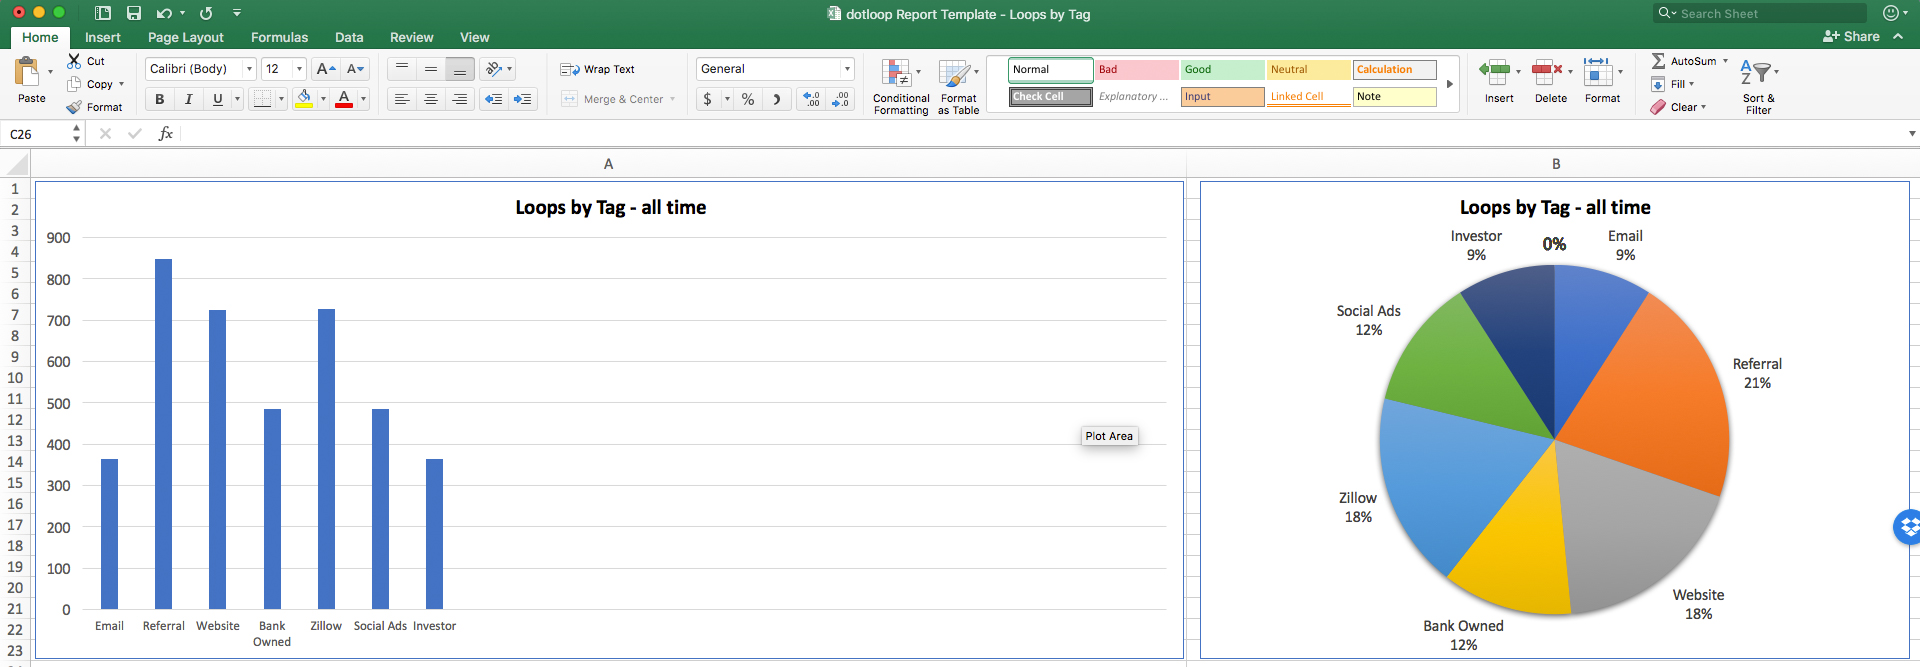
The template will break down your data and automatically populate a report that you can easily analyze in tabs Charts – Tags and Calculations – DO NOT EDIT.
In the charts below, you can see that the top 3 lead sources in our sample data are Referrals (21%), Website (18%), and Zillow (18%).

From the Calculations tab, in the highlighted columns (S and U), you can see that Referrals has the most transactions closing this month, but the Website generated the more leads-to-close deals last month.

Check out last week’s tip on using the Report Builder to create financial reports.


