


How To Bring Your Broker Reporting To Life with Visual Dashboards
By Gabriel Hagstrom, Dotloop Guest Blogger
May 21, 2021 | comments
Get At-a-Glance Visibility Into Your Business, Including Hot Zip Codes, Volume, Agent Productivity, Loop Status and More
Imagine you’re driving a new car on a long road trip. You pull onto the empty highway and hit the gas, glancing down to check your speed and then you realize this car doesn’t have a dashboard! You can’t tell how fast you’re going, how much gas you have left, if the engine is overheating or if the tires need air — all the key information you as a driver need summarized and in front of you so you can get where you’re going quickly, efficiently and safely.
Your real estate business is no different. There are key pieces of information regarding the health and velocity of your business that you need in front of you. You need this information to be easy to read at a glance, so that you and your agents can speed along to the success you’ve envisioned.
What Kind of Real Estate Transaction Data Can Go On Your Broker Dashboard?
That’s a great question. As a dotloop user, you and your team are already gathering a great deal of data from your real estate transaction management software. Using that data, you could create something that looks like this:
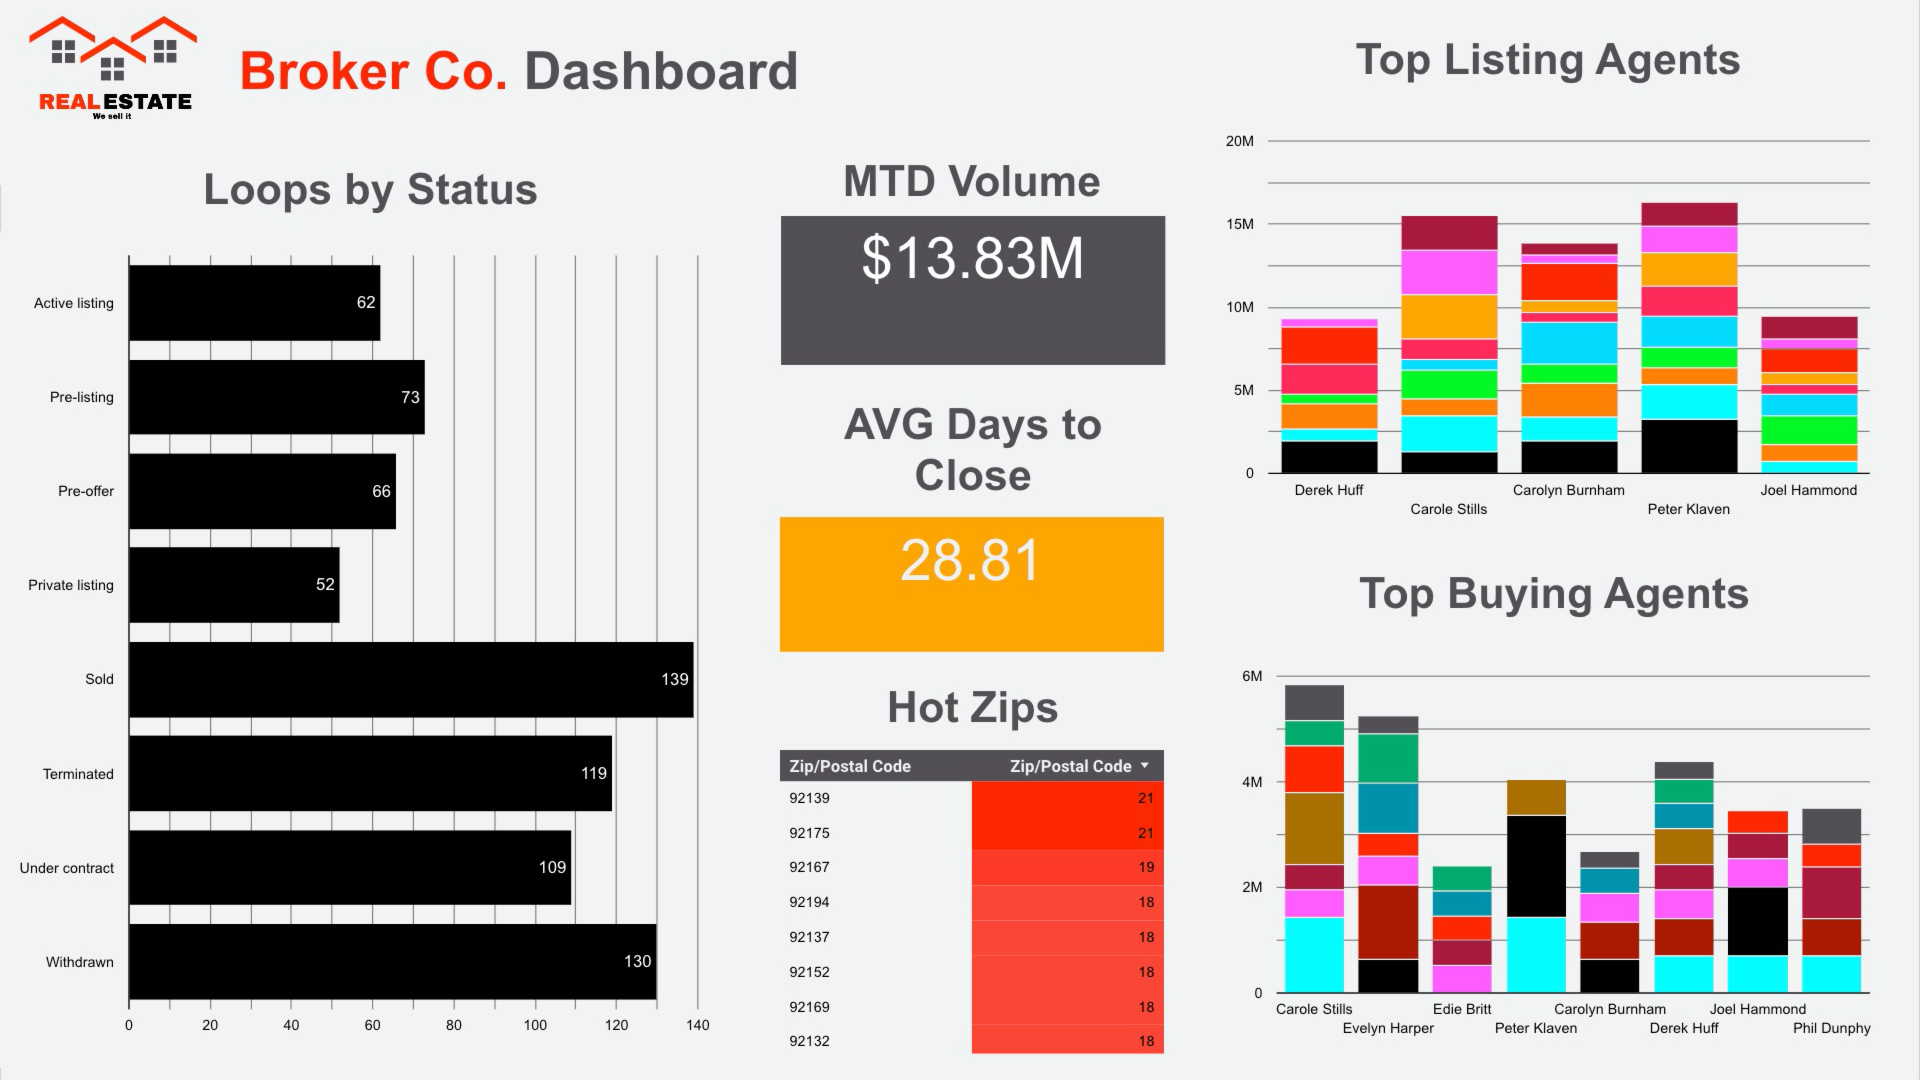
This dashboard lets you know at a glance:
- Average Days to Close
- Zip codes that are performing well
- Volume month to date
- Agents’ performance
- Loops in each status
Best of all, because it’s using your dotloop data, you can have this up and ready to use in just a few clicks — giving you a quick snapshot of your real estate business’s performance.
How to Create Your Broker Reporting Dashboard Using Dotloop Data
- Go to the dotloop integrations directory
- Choose and set up the Google Sheets or Google Drive integration.
- Note: Either integration will create the spreadsheets you need to power the dashboard; the Google Drive integration will have the added benefit of also backing up all your documents into an organized folder in Google Drive.
- Open up the Broker dashboard template from above.
- Click the three dots, and select “make a copy.”
- Click the drop down under “New Data Source” and then select “Create Data Source.”
- Click on “Google Sheets” and locate your Google Sheet called “dotloop loops” that was created by the API Nation integration previously.
This will create your own live and updating copy of the dashboard in your Google Data Studio account. You can even add additional charts to your dashboard like:
- Referral sources
- Active listings
- Transaction / agent
- Total revenue
- Total commission
How To Add Charts and Graphs to Your Reporting Dashboard
Now that you’ve created your reporting dashboard using Google Data Studio, you’ll want to add the exact charts and graphs you need in order to get real-time visibility into your agents’ productivity, pipelines and more. Follow the steps in the below video to get started.
How to Share, Display and Embed your Dotloop Reporting Dashboard
You’ve created your dotloop broker reporting dashboard, then added charts and graphs to it so you can stay on top of your business’s daily performance. Great job! We have one more step… sharing the dashboards with your team and brokerage. Follow the steps in the below video to discover the four ways to do it.
Want to Create an Admin / Transaction Coordinator Dashboard Too?
If you’re a transaction coordinator, you have your eyes on slightly different metrics that can inform how you approach every day. We’ve built out a template especially for you:
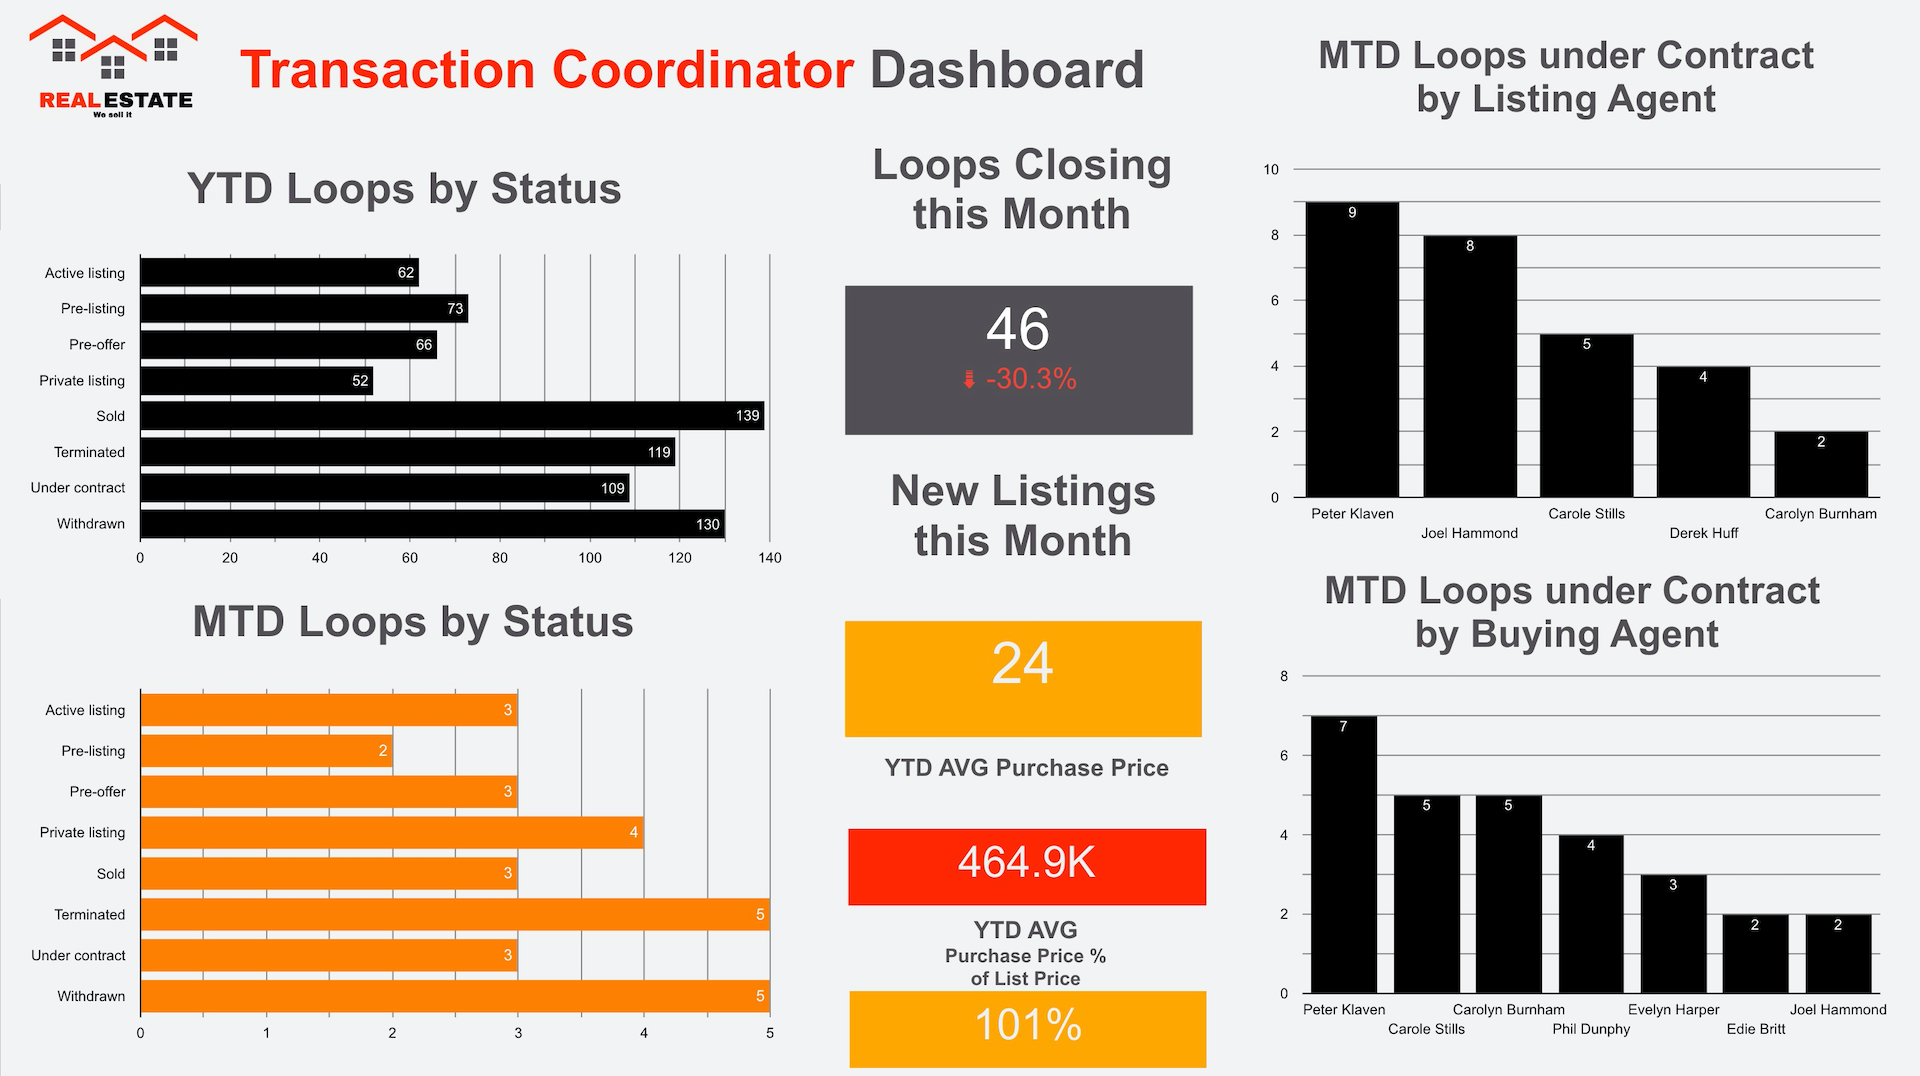
The Transaction Coordinator Dashboard template displays information including:
- Year-to-date loops by status
- Month-to-date loops by status
- Loops closing the month
- New listings this month
- Loops under contract by agent
- Year-to-date average purchase price
Ready to Get Started on Your Dashboard?
These are just a few examples of the dashboard you can set up using your dotloop data and, in some cases, by blending in a bit of data from other easily accessible sources. Get started by setting up your Google Sheets or Google Drive integration in the dotloop Integrations Directory.

Gabriel Hagstrom
Gabe Hagstrom has been designing and executing marketing strategies for over a decade across the real estate, tech, ecommerce and fitness industries. He gets out of bed everyday with a mission to make complicated ideas simple. Along with the rest of the team at API Nation, he has set out to build a platform where the complications of connecting and automating a world of apps are made simple. You can find him in San Diego, teaching hundreds of real estate professionals how to run their business and marketing more efficiently by connecting and automating their applications.